Shining a Light on Raw Materials
Let’s get into the data that we collected with our hyperspectral cameras. When we got samples from the cement and steel production, we measured them in our lab, placing each sample side by side and scanning them with our cameras.
Just to remind you, we are scanning in wavelength ranges that include wavelengths in the visible light, the same color information that we can see with the naked eye, but our hyperspectral cameras far surpass this and are able to detect longer wavelengths up to 2500nm. In these wavelength ranges we can see material changes that tells us information about the chemistry (for example the mineral content or iron content) or the physical characteristics of the surface (for example the grain size).
Though this is not a direct measurement, the reflected light from the surface can be used to indicate this information. Before looking at the actual original and used brick products that are being used in cement and steel production, we wanted to look at the input raw materials that go into the brick production to get an idea about their spectral “fingerprint”. Doing that is important, even though the bricks themselves change a bit in composition because of the heat and pressure that they experience during use and the different gases and fumes that affect them and cause e.g., changes in mineral composition.
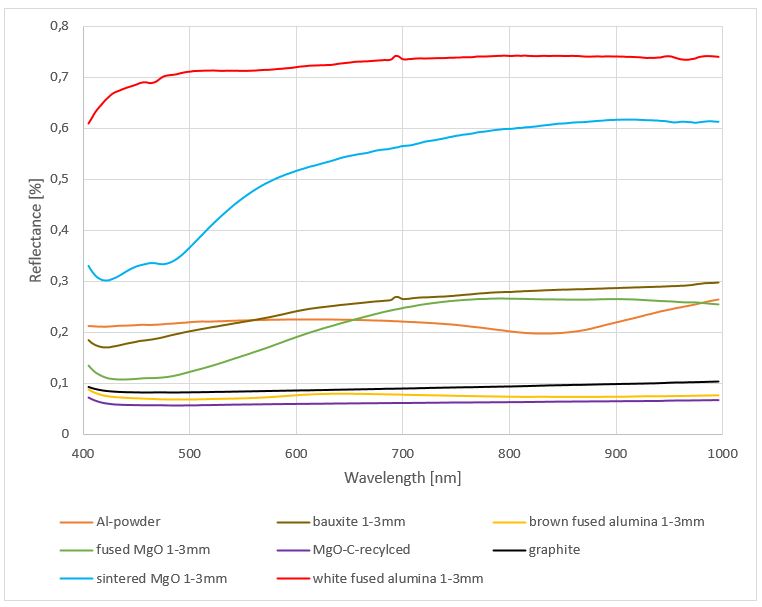
For the steel casting ladle bricks, the main input raw materials are plotted in the visible to near-infrared wavelengths region below (400 – 1000nm, abbreviated as “VNIR”).
You can see that the plotted lines (spectra) show some differences. For example, the two different MgO components, fused (green) and sintered (blue) look very different from each other.
In the second step, we wanted to try to classify the different materials by training a model on the existing data and predicting the class of each pixel in the image. The table below shows the prediction of each pixel (pixel-based). It also shows the class prediction of the raw material for the whole image that is either based on counting the pixels and assigning a class based on the dominant class of all pixels (pixel-class majority) or creating an average spectrum from all pixels in the image and predicting the class based on this one spectrum (average spectrum).
You can see that for this smaller subset of materials, the prediction of raw materials seems to work rather well using VNIR-data, even though not all pixels are classified perfectly (e.g. see the diverse pixel classification in Bauxite 3-6mm)


Author’s Portrait
Friederike Koerting
Dr. Friederike Koerting is working for HySpex by Norsk Elektro Optikk AS as the Geological Hyperspectral Application Specialist. HySpex by NEO is the industry-leading brand for airborne and ground-based hyperspectral imaging and is a manufacturer of advanced electro-optical products.
Friederike is applying hyperspectral imaging to help miners mitigate risks, unlock value and save time. She enjoys communicating with and to users from research and industry alike, furthering her understanding of their needs, and the possible impact of applying HySpex solutions has on users. Friederike is passionate about creating accessible platforms with a user-first mindset and establishing long-lasting channels of communication for discussions and insights. She aims to apply her expertise in the field of technology-driven sustainable mining with a regard to environmental preservation and protection. That ultimately led her to start working for HySpex in April 2021 and for her to join the ReSoURCE project activities.
Friederike Koerting
AuthorDr. Friederike Koerting is working for HySpex by Norsk Elektro Optikk AS as the Geological Hyperspectral Application Specialist.
friederike@neo.no